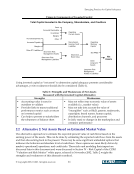
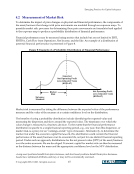
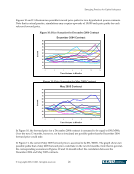
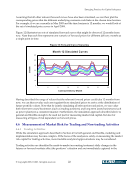
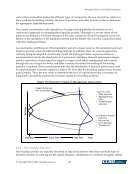
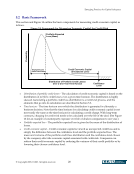
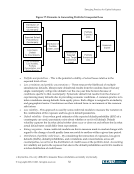
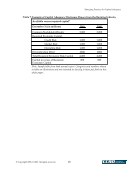
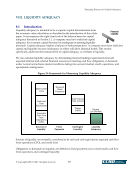
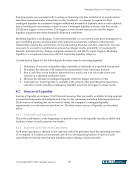
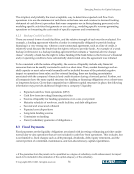
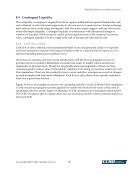
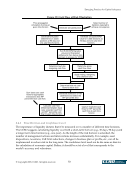
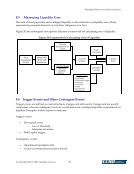
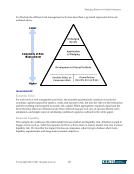
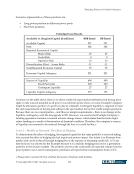
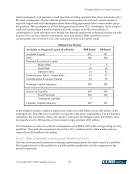
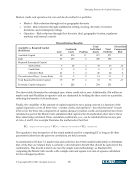
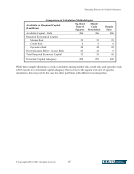
Emerging Practices for Capital Adequacy © Copyright 2003, CCRO. All rights reserved. 63 Example Company A sample portfolio is constructed for Example Company containing a gas-fired combined-cycle plant, a coal-fired base load plant, and a peaking facility with the following characteristics: Unit Market Capacity (MW) Variable O&M ($/MWh) Heat Rate (MMBtu/ MWh) Fuel Outage Rate Combined Cycle ECAR 850 3.98 7.25 Nat Gas 3% Base Load NEPOOL 375 2.51 10.3 Coal 12% Peaking PM 500 34.48 15.7 Jet Kero 6% Market, credit and operative risk are calculated for a one-year holding period at a 95% confidence interval through a Monte Carlo simulation consisting of 5,000 trials for positions with a 5-year duration. Fuel and power price changes are modeled at spot for the first year and as forward prices for years 2 through 5, with forward prices modeled as correlated Brownian motion. Credit, operations, and operational risk are simulated by an event methodology based on uniform distributions. If the simulation pull is smaller than the probability of the event (e.g., simulation pull = 0.03 and probability of default = 0.05), then there is an event. Each counterparty has an associated probability of default, each plant has a probability of an outage, and there is a probability of trader misconduct. In this example, hedging reduces liquidity risk19. Hedging creates both the cash burden of full margin mark-to-market and the possibility of credit losses. However, hedging also decreases the volatility of generating P/L. The simulation results show that hedging decreases the cash flow uncertainty. In this example, contingent liquidity is decreased in the hedged case, even though an incremental $7 million in margin would be required in the event of a downgrade. Results Level 1 – Top of Pyramid: Assessing Unhedged Assets We begin by quantifying the capital requirements associated with owning and deploying assets. The purpose is to illustrate the capital required for Example Company’s assets when no hedging is used to manage the market risk associated with the positions created by owning and deploying the assets. 19 Liquidity risk is defined as the minimum cash flow point in a simulation, where cash flow = cash posted to the power pools + prior month realized P/L (retained earnings) + current month generation P/L + trading A/R + trading A/P + full margin on mark-to-market +credit loss + operations loss + operational loss.
Purchased by unknown, nofirst nolast
From: CCRO Library (library.ccro.org)