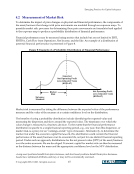
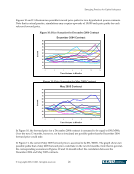
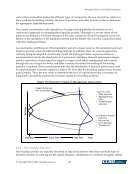
Emerging Practices for Capital Adequacy © Copyright 2003, CCRO. All rights reserved. 21 Figures 10 and 11 illustrate ten possible forward price paths for two hypothetical power contracts. Note that in actual practice, simulations may require upwards of 10,000 such price paths for each relevant forward price. Figure 10: Price Scenarios for December 2004 Contract Figure 11: Price Scenarios for May 2005 Contract In Figure 10, the forward price for a December 2004 contract is assumed to be equal to $30/MWh. Over the next 12 months, however, we have simulated ten possible paths that the December 2004 forward price could take. In Figure 11, the current May 2005 forward price is assumed to be $31/MWh. The graph shows ten possible paths that a May 2005 forward price could take in the next 12 months. Note that in general, the corresponding scenarios in Figures 10 and 11 should reflect the correlation between the December 2004 and May 2005 contracts. December 2004 Contract 0 10 20 30 40 50 60 70 80 90 0 10 20 30 40 50 60 70 80 90 0 2 4 6 8 10 12 Time Horizon in Months $/mwh May 2005 Contract 0 10 20 30 40 50 60 70 80 90 0 10 20 30 40 50 60 70 80 90 0 2 4 6 8 10 12 Time Horizon in Months $/mwh
Purchased by unknown, nofirst nolast
From: CCRO Library (library.ccro.org)