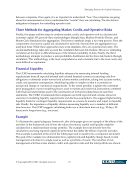
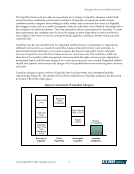
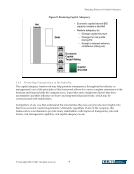
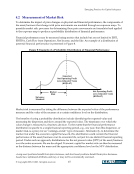
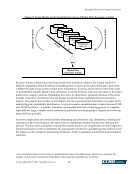
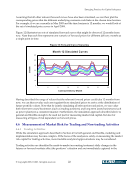
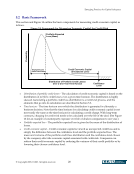
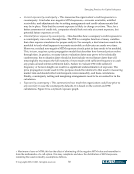
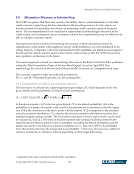
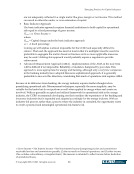
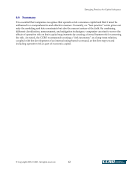
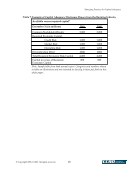
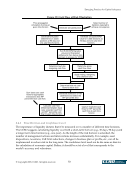
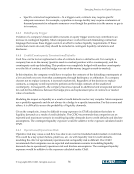
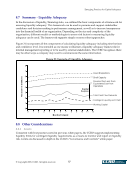
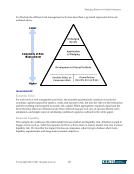
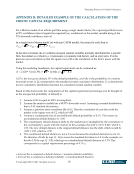
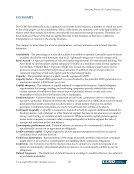
Emerging Practices for Capital Adequacy © Copyright 2003, CCRO. All rights reserved. 53 Figure 19: Cash Flow at Risk Illustration 8.4.2 Time Horizon and Confidence Level The importance of liquidity dictates that it be measured over a number of different time horizons. The CCRO suggests calculating liquidity over both a short-term horizon (e.g., 30 days, 90 days) and a longer-term time horizon (e.g., one-year). As the length of the risk horizon is extended, the number of management actions and interventions increases substantially. For example, asset dispositions, novations, VaR limit reductions, changes in business plan or profile, etc., can all be implemented to reduce risk in the long term. The confidence level need not be the same as that for the calculation of economic capital. Rather, it should be set at a level that corresponds to the model’s accuracy and robustness. Generate simulated prices Generate simulated MTM value for 5,000 iterations at 90-day and one-year time horizons Generate forecasted settlements on asset positions at 90-day and one-year time horizons Sort 5,000 MTM iteration values and forecasted settlements then derive slice numbers to process for CFaR Determine next-day margining cash flow Determine gross cash flow value Apply netting, margining and collateral rules Determine total net cash flows for each slice Generate distribution of net cash flows and select the 99th percentile slice Calculate cash flow differential between base case expected cash flow and 99th percentile cash flow for each time horizon Capture expected cash flows for 99th percentile cash flow at each time horizon Price propagation simulation of prices at given time horizon Select number of iterations required to achieve convergence Sum base case cash flows for appropriate transactions less 99th percentile slice cash flow
Purchased by unknown, nofirst nolast
From: CCRO Library (library.ccro.org)