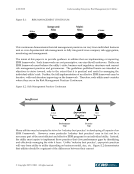
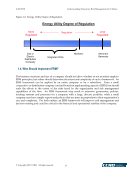
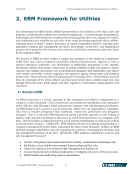
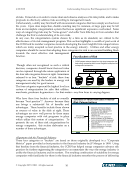
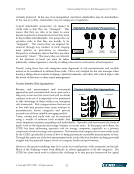
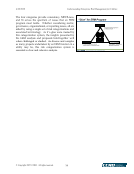
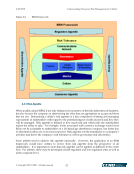
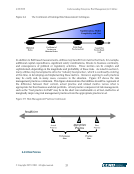
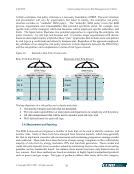
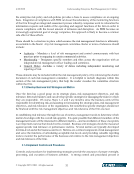
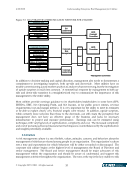
4/20/2020 Understanding Enterprise Risk Management for Utilities © Copyright 2007, CCRO. All rights reserved. 25 Figure 2.4: The Continuum of Earnings Risk Measurement Techniques In addition to EaR based measurements, utilities may benefit from metrics that track, for example, additional capital expenditures, significant safety ramifications, threats to business continuity, and consequences of political or regulatory activities. These metrics can be complex and sophisticated, depending on the magnitude and probability of these risks. As noted in section 1, many utilities may be tempted to strive for ‘industry best practice’, which is continually evolving at this time, in developing and implementing these metrics. However, aspiring to such practices may be costly and, in many cases, excessive to the situation. Figure 2.5 shows the risk management practices continuum. This figure demonstrates that utilities should be cognizant of the difference between their current, actual practice and related metrics versus what is appropriate for their business and risk portfolio. A best practice component of risk management, such as the “best practice for EaR” may be in the short run unattainable or, at best, ineffective at marginally improving risk management practices from the appropriate practice level. Figure 2.5: Risk Management Practices Continuum 2.4.5. Risk Policies Historical Ratios Ratio Based Pro-forma EaR Causal Risk Factor-Based EaR Coefficient of Variance on Historical Series Sophistication, Model Complexity and Cost Insufficient Best Practice Appropriate Practice Actual Practice Practice Gap Performance Gap
Purchased by unknown, nofirst nolast
From: CCRO Library (library.ccro.org)