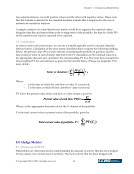
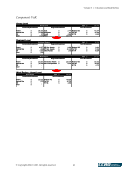
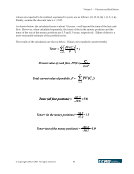
Volume 3 — Valuation and Risk Metrics © Copyright 2002, CCRO. All rights reserved. 51 are positive and sum to 1. Therefore, the DUR defined above will be between 0 and the time of the most distant cash flow. (This is the same concept as the expected value of a random variable being bounded by its largest possible value.) NOTE 3: For cash flows of mixed sign the results can be counterintuitive. Take, for example, cash flows of size –1 and +1.2 occurring at times 1 t1 = and 2 t2 = , respectively, when interest rates are .05 y = . The duration is approximately 9.06, well beyond the time of the last cash flow. This is simply because the weighting coefficients are of mixed sign and DUR, while remaining a relevant statistic regarding exposure to funding costs, is no longer readily interpreted as an average of cash flow tenors. While the concept of DUR cannot be interpreted as a tenor for mixed cash flows, the interpretation is clearly preserved for the durations of the positive and negative cash flows separately, denoted by: DUR + and DUR − , respectively. One viable measure of the tenor of the aggregate cash flow profile that has the desired attribute of taking a value bounded by the tenor of the most distant cash flow is: max DUR ,DUR + − . The tenor metric calculation described in Section II-7.2 uses a formula for duration. Indeed, calculation of duration as employed in financial markets uses a similar formula but the focus is on measuring the sensitivity of a portfolio of positions or cash flows to changes in the underlying discount rate (r). Typically, in financial markets, duration is used in the context of interest-rate-sensitive claims such as bonds. Because the cash flows from a bond are typically all of the same sign (receipts for a bond that is owned or held long, payments for a bond that is owed or held short), the formula can be applied in a straightforward manner. On the other hand, calculating duration of a portfolio in which some interest-rate-sensitive instruments are in the money and others are out of the money requires a modified approach. In this case, two durations are calculated—one for the long instruments and the other for the short instruments. This type of analysis is common in the case of bank portfolios and is typically called Duration-Gap analysis. Similarly, we can perform two tenor calculations—one for all positions that are currently in the money (where the present values are all positive), and one for all positions that are currently out of the money (where the present values are all negative). Transactions involving spread- type deals, for example, can be easily accommodated under this approach. The tenor for the portfolio can be reported in one of two ways: the tenors for in the money positions and out of the money positions can be reported separately, or just the larger of the two tenors can be reported. The following is a simple example of the tenor calculation given positions that are in and out of the money. Assume a portfolio has four transactions, two in the money and two out of the money: (c1, c2, c3, c4) = ($30M, —30M, 10M, —25M). Also assume that the times at which the
Purchased by unknown, nofirst nolast
From: CCRO Library (library.ccro.org)