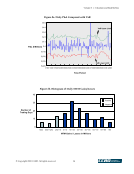
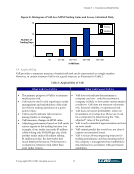
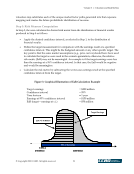
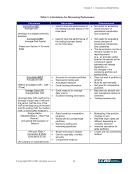
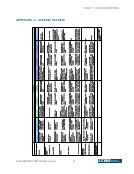
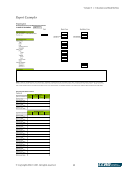
Volume 3 — Valuation and Risk Metrics © Copyright 2002, CCRO. All rights reserved. 23 For the non-market years, the risk around fair value is determined by calculating the fair value for several occurrences of the risk drivers to obtain a histogram (i.e., a dispersion of the values around the mean or expected value). A measure of the risk can be obtained from the histogram, such as the expected fair value, the ninety-fifth percentile fair value, or the fifth percentile fair value. In addition to the risk metric, stress tests and sensitivity analysis should be run to further analyze the results of asset valuation. (See Section III on Sensitivity Analysis, Scenario Analysis, and Stress Testing.) 5.3 Typical Outputs Appendix B contains example reports for several of the outputs (asset performance and risk analysis report, equivalent net open positions report, and component VaR report). 6.0 Performance Metrics In addition to the primary risk metrics, companies use other metrics to analyze specific areas within the business. Most of these measures are used for internal evaluation to make better risk management decisions. As with any metric, there are advantages and disadvantages to use and application. Table 3 presents some of the calculations used to measure performance. The individual company needs to determine which performance measures are best suited to evaluate its activity compared with its corporate goals and objectives. In addition, some measures may be more useful when analyzed over time rather than at a single point in time.
Purchased by unknown, nofirst nolast
From: CCRO Library (library.ccro.org)