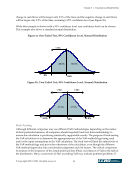
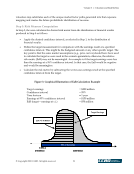
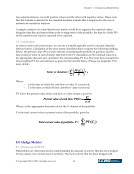
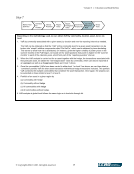
Volume 3 — Valuation and Risk Metrics © Copyright 2002, CCRO. All rights reserved. 21 valuation step substitutes each of the unique market factor paths generated into that exposure mapping and creates the future probabilistic distribution of revenue. Step 5: Risk Measure Computation In Step 5, the user calculates the desired risk metric from the distribution of financial results produced in Step 4 as follows. • Apply the desired confidence interval, as selected in Step 1, to the distribution of financial results. • Define the target measurement for comparison with the earnings result at a specified confidence interval. This might be the budgeted amount or any other specific target. The key point is that the same market assumptions (e.g., price curves) should have been used to calculate the target as were used in the scenario generation otherwise, the relative risk metric (EaR) may not be meaningful. An example is if the target earnings were less than the earnings at a 95% confidence interval. In that case, the EaR would be negative and would be meaningless. • Calculate the risk metric by subtracting the worst-case earnings result at the specified confidence interval from the target. Figure 3. Graphical Illustration of EaR Calculation Example Target earnings = $200 million Confidence interval = 95% Time horizon = 1 year Earnings at 95% confidence interval = $150 million EaR (target – earnings at c.i.) = $50 million X 95% ci $200 Million $150 Million EaR = $ 50 Million 95% of Outcomes Target Earnings X 95% ci $200 Million $150 Million EaR = $ 50 Million 95% of Outcomes Target Earnings
Purchased by unknown, nofirst nolast
From: CCRO Library (library.ccro.org)