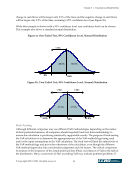
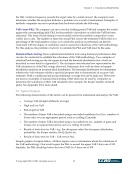
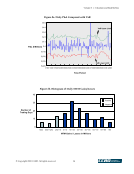
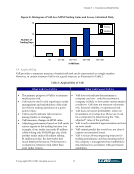
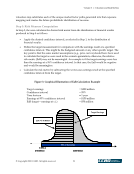
Volume 3 — Valuation and Risk Metrics © Copyright 2002, CCRO. All rights reserved. List of Figures Figure 1a. One-Tailed Test, 95% Confidence Level, Normal Distribution ..................................... 14 Figure 1b. Two-Tailed Test, 95% Confidence Level, Normal Distribution .................................... 14 Figure 2a. Daily P&L Compared with VaR ...................................................................................... 16 Figure 2b. Histogram of Daily MTM Gains/Losses ........................................................................ 16 Figure 2c. Histogram of VaR Less MTM Trading Gains and Losses, Calculated Daily ................ 17 Figure 3. Graphical Illustration of EaR Calculation Example ......................................................... 21 List of Tables Table 1. Comparison of Attributes of Methods for Calculating Value at Risk .............................. 12 Table 2. Applicability of VaR............................................................................................................. 17 Table 3. Calculations for Measuring Performance ........................................................................... 24 Table 4. Comparison of Hedge Metrics ............................................................................................ 28
Purchased by unknown, nofirst nolast
From: CCRO Library (library.ccro.org)