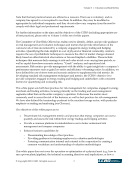
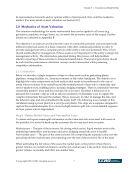
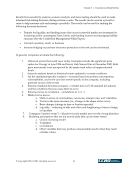
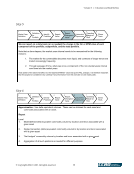
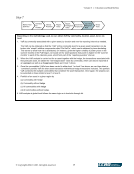
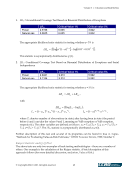
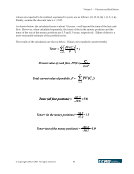
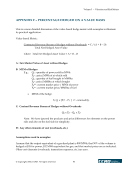
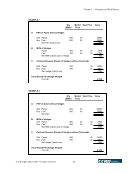
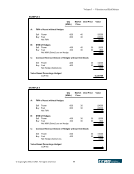
Volume 3 — Valuation and Risk Metrics © Copyright 2002, CCRO. All rights reserved. 39 Step 7 Market Year Definition Definition for Portfolio Identify Positions Report: Value Report: Changes in Value Volumetric Exposures Operating Margin at Risk Stress Tests 1 2 3 4 5 6 7 8 Depending on the methodology used, we can obtain VaR by commodity, location, asset, tenor, etc. Level 1. VaR by commodity associated with a given asset, by location and over the reporting interval as needed. The VaR can be obtained so that the “VaR” at the commodity level for a given asset transaction can be broken into “simple” additive components called “Del-VaR’s,” which can be obtained by tenor bucketing. This serves to show how risk is distributed for instance, given the higher volatility of power prices in the summer months in the PJM region, we would see for asset positions that power is higher for the “summer months” in each of the calendar years, which form part of the “reporting quarters” interval. 2. When the VaR analysis is carried out for an asset together with the hedge, the transactions associated with that particular asset, we obtain the “net hedged asset” value by commodity, which can also be reported at an aggregate as well as a disaggregated basis as in level 1 above. 3. Once the commodities’ VaRs have been carried in either level 1 or level 2 as above, we can then obtain a “combined” portfolio VaR for other asset transaction with/without hedge transactions included. This portfolio VaR combines the multiple commodities that constitute the asset transaction. Once again, the analysis can be extended on lines similar to level 1 or level 2. 4. Portfolio of an asset in a given region by (a) Commodity with hedge (b) Commodity without hedge (c) All commodities with hedge (d) All commodities without hedge. 5. VaR analysis at global level follows the same logic as in levels 4a through 4d.
Purchased by unknown, nofirst nolast
From: CCRO Library (library.ccro.org)