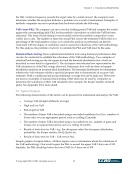
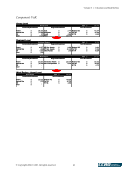
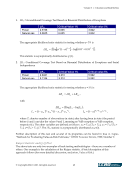
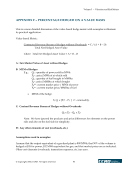
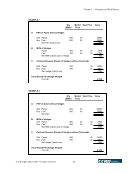
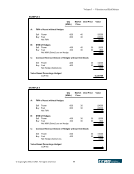
Volume 3 — Valuation and Risk Metrics © Copyright 2002, CCRO. All rights reserved. 48 1. LRuc: Unconditional Coverage Test Based on Binomial Distribution of Exceptions LRuc Critical Value 1% Critical value 5% Power 2.5196 6.635 3.842 Natural gas 0.0945 6.635 3.842 The appropriate likelihood ratio statistic for testing whether α= 5% is (1− )T − ). x LRuc −x −x = 0.95T log(0.05x log 2 This statistic is asymptotically distributed as 2(1). 2. LRcc: Conditional Coverage Test Based on Binomial Distribution of Exceptions and Serial Independence LRcc Critical Value 1% Critical value 5% Power 2.9421 9.210 5.992 Natural gas 5.1184 9.210 5.992 The appropriate likelihood ratio statistic for testing whether α = 5% is LRind LRuc LRcc + = , with ), log 2(log L0 LA LRind − = (1− )T00 (1− )T10 11 11 01 01 T11 T01 LA = , (1− )T00 T01 L0 +T11 +T10 = , where Tij denotes number of observations in state j after having been in state i the period before (i and j can take the values 0 and 1, meaning no VaR exception or VaR exception, respectively). The other variables are defined as follows: 01 = T01/(T00 + T01), 11 = T11/(T10 + T11), =(T01 + T11)/T. The LRcc statistic is asymptotically distributed as 2(2). Further description of this test and several of its properties can be found in Jose A. Lopez, “Methods for Evaluating Value-at-Risk Estimates,” FRBSF Economic Review, 1999, Number 2. Kuiper Statistic and Q-Q Plot The above tests are only two examples of back-testing methodologies—there are a number of others. One example is the calculation of the Kuiper statistic. A brief description of this approach follows (for more detailed discussion, see Jorion, Value at Risk.)
Purchased by unknown, nofirst nolast
From: CCRO Library (library.ccro.org)