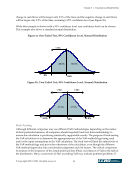
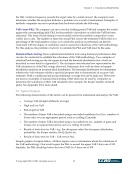
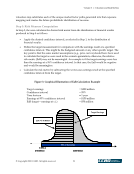
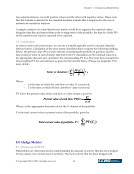
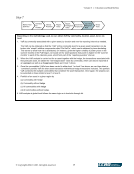
Volume 3 — Valuation and Risk Metrics © Copyright 2002, CCRO. All rights reserved. 14 change in cash flows will be larger only 2.5% of the time and the negative change in cash flows will be larger only 2.5% of the time, assuming a 95% confidence level (see Figure 1b). While this example is shown with a 95% confidence level, any confidence level can be chosen. This example also shows a standard normal distribution. Figure 1a. One-Tailed Test, 95% Confidence Level, Normal Distribution 1.65 95% 5% 45.0% 50.0% Figure 1b. Two-Tailed Test, 95% Confidence Level, Normal Distribution 47.5% 1.96 1.96 2.5% 2.5% 95% 47.5% Back-Testing Although different companies may use different VaR methodologies depending on the nature of their particular business, all companies should regularly back-test their methodology to ensure the calculation is producing statistically supportable results. The purpose of back-testing the VaR calculation is to determine the appropriateness of the VaR methodology being used and/or the input assumptions in the VaR calculation. The back-test will limit the subjectivity of the VaR methodology and prove the robustness of the calculation, even though the different VaR methodologies take into consideration judgments and risk factors. The critical component to measure is the frequency of the actual profit and loss (P&L) exceedances of VaR in the tails of the distribution. Many occurrences of P&L exceeding VaR may indicate potential problems. If
Purchased by unknown, nofirst nolast
From: CCRO Library (library.ccro.org)