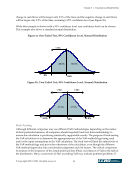
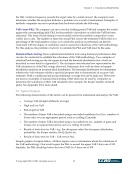
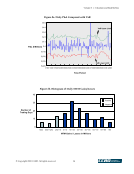
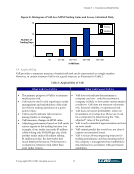
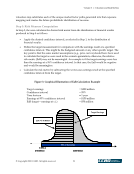
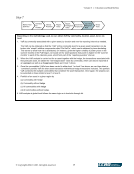
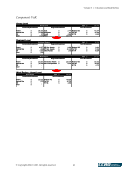
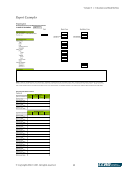
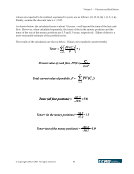
Volume 3 — Valuation and Risk Metrics © Copyright 2002, CCRO. All rights reserved. 15 the P&L violation frequency exceeds the target value by a small amount, the company must determine whether the exception indicates a problem or is a result of randomness. Examples of methods companies can use to perform their back-tests include the following: VaR versus P&L: The company can run a one-day holding period VaR and compare the results against the corresponding daily P&L for the portfolio of positions on which the VaR has been estimated. This form of back-testing is most suitable where the portfolio composition varies widely day to day. The number of times the actual P&L crosses the estimated VaR level(s) as a percentage of the total number of days over which this analysis is performed can then be contrasted with the degree of confidence used to assess the robustness of the VaR methodology. For this analysis, the portfolio of activity to calculate the P&L and VaR must be the same. Statistical Back-Testing: More sophisticated statistical tests using historical performance data can also be conducted to establish the robustness of the VaR methodology. Two examples of statistical back-testing are the chi-square test and the binomial distribution test, which are described in more detail in Appendix D. The chi-square test indicates how representative the VaR calculation is of the P&L swings observed. It measures how well an observed sample distribution matches an assumed ideal distribution. The binomial distribution test determines whether the VaR estimates exhibit a specified property that is characteristic of accurate VaR estimates. Both a conditional and an unconditional coverage test can be analyzed. These tests are just two examples of statistical back-testing. Other tests may be used by companies to determine the soundness of their VaR calculation (for example, the Kuiper statistic and Q-Q plots). See Appendix D for more detail. 3.3 Typical Outputs The following characteristics of the metric can be presented to understand and analyze the VaR: • Average VaR (straight arithmetic average) • High and low VaR • End-of-period VaR • The number of times VaR is breached using a one-tailed confidence level (i.e., number of losses only) over an appropriate period, such as a rolling 12 months • The number of times VaR is breached using a two-tailed test (i.e., number of gains and losses) over an appropriate period, such as a rolling 12 months • Results of back-tests for VaR – e.g., the chi-square value, the chi-square distribution probability, the Kuiper statistic, the Q-Q plot, etc. • Results of back-tests for VaR – VaR versus P&L Sample graphs of outputs follow. All these figures convey information about the robustness of the VaR methodology. One would expect the P&L to exceed the upper VaR 3 days out of 100. Similarly, the P&L should go below the lower VaR 2 to 3 days out of 100.
Purchased by unknown, nofirst nolast
From: CCRO Library (library.ccro.org)