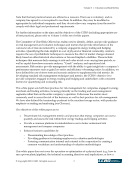
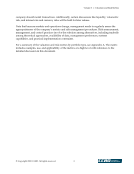
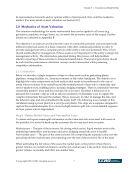
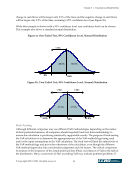
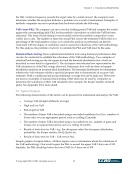
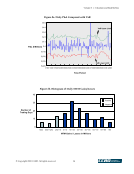
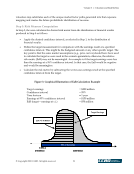
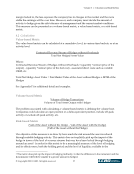
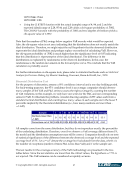
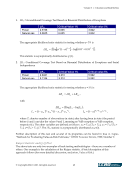
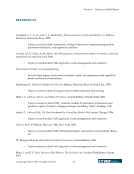
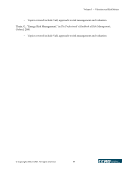
Volume 3 — Valuation and Risk Metrics © Copyright 2002, CCRO. All rights reserved. 16 Figure 2a. Daily P&L Compared with VaR $(4.0) $(3.0) $(2.0) $(1.0) $-0 $1.0 $2.0 $3.0 $4.0 $5.0 1/1/00 1/8/00 1/15/001/22/001/29/00 2/5/00 2/12/002/19/002/26/00 3/4/00 3/11/003/18/003/25/00 4/1/00 4/8/00 P&L $ Millions VaR Upper Limit VaR Lower Limit Time Period Figure 2b. Histogram of Daily MTM Gains/Losses Number of Trading Days 40 30 20 10 0 (50) (25)0 010 1025 2540 4055 (50)(25) 5570 7085 85 MTM Gains / Losses in Millions Positive Negative Positive Negative
Purchased by unknown, nofirst nolast
From: CCRO Library (library.ccro.org)