17
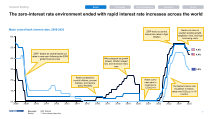
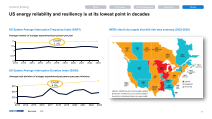
US energy reliability and resiliency is at its lowest point in decades
Context Setting Technology Policy &Regulatory Geopolitics Climate Market
0
200
400
600
2013 2014 2015 2016 2017 2018 2019 2020 2021 2022 2023
0
0.5
1
1.5
2
2013 2014 2015 2016 2017 2018 2019 2020 2021 2022 2023
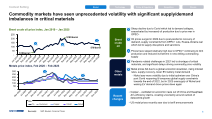
US System Average Interruption Frequency Index (SAIFI)
US System Average Interruption Duration Index (SAIDI)
Average number of outages experienced per person per year
Average total duration of outages experienced per person per year (minutes)
CAGR
1.3%
Source(s): EIA
CAGR
4.9%
NERC electricity supply shortfall risk area summary (2025-2029)
US energy reliability and resiliency is at its lowest point in decades
Context Setting Technology Policy &Regulatory Geopolitics Climate Market
0
200
400
600
2013 2014 2015 2016 2017 2018 2019 2020 2021 2022 2023
0
0.5
1
1.5
2
2013 2014 2015 2016 2017 2018 2019 2020 2021 2022 2023
US System Average Interruption Frequency Index (SAIFI)
US System Average Interruption Duration Index (SAIDI)
Average number of outages experienced per person per year
Average total duration of outages experienced per person per year (minutes)
CAGR
1.3%
Source(s): EIA
CAGR
4.9%
NERC electricity supply shortfall risk area summary (2025-2029)