14
0%
5%
10%
15%
20%
25%
30%
Jan-18 Jul-18 Jan-19 Sep-19 Mar-20 Feb-21 Apr-22 Apr-23
0%
10%
20%
30%
40%
50%
60%
70%
80%
90%
100%
Jan-18 Jul-18 Jan-19 Sep-19 Mar-20 Feb-21 Apr-22 Apr-23
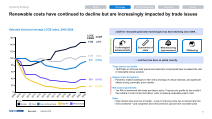
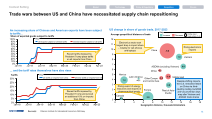
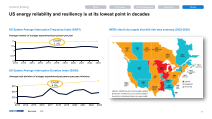
Trade wars between US and China have necessitated supply chain repositioning
Context Setting
An increasing share of Chinese and American exports have been subject
to tariffs…
Technology Policy &Regulatory Geopolitics Climate Market
Source(s): Peterson Institute for International Economics, McKinsey
Share of exported goods subject to tariffs
Tariffs
… and the tariff rates themselves have also risen
Key
US exports subject to Chinese tariffs Chinese exports subject to US tariffs
Key
US tariffs on imports from China Chinese tariffs on imports from US
0.3
1.4 0.1
2.9
-0.4
-0.2
-0.8
0.8
0.8
1.0
-5.8
0
1
2
3
4
5
6
7
8
9
10
11
12
0 2 4 6 8 10 12 14 16 18
China
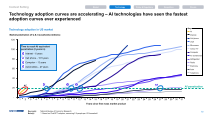
US change in share of goods trade, 2017-2023
Average geopolitical distance of trade
Vietnam
ASEAN (excluding Vietnam)
Africa
Middle East Other Europe
and Central Asia
Latin America
Mexico
Canada
Europe Rest of Asia-
Pacific
Geographic distance, thousand kilometers
Key
Increase Decrease
Circle size =
trade share %Δ
Rising export of energy
resources and imports of
pharmaceutical goods
Rising electronics
imports
Electronics sector saw
largest drop in import share
– notably for cell phones
and laptops
Despite shifting imports,
the U.S. remained reliant
on China via third-
country routing, but 2023
anti-circumvention laws
may alter Vietnam and
ASEAN trade shares
Recent tariffs imposed by
President Trump announced
an additional 10% on imports
from China
Recent tariffs imposed by
President Trump place tariffs
on all imports from China
0%
5%
10%
15%
20%
25%
30%
Jan-18 Jul-18 Jan-19 Sep-19 Mar-20 Feb-21 Apr-22 Apr-23
0%
10%
20%
30%
40%
50%
60%
70%
80%
90%
100%
Jan-18 Jul-18 Jan-19 Sep-19 Mar-20 Feb-21 Apr-22 Apr-23
Trade wars between US and China have necessitated supply chain repositioning
Context Setting
An increasing share of Chinese and American exports have been subject
to tariffs…
Technology Policy &Regulatory Geopolitics Climate Market
Source(s): Peterson Institute for International Economics, McKinsey
Share of exported goods subject to tariffs
Tariffs
… and the tariff rates themselves have also risen
Key
US exports subject to Chinese tariffs Chinese exports subject to US tariffs
Key
US tariffs on imports from China Chinese tariffs on imports from US
0.3
1.4 0.1
2.9
-0.4
-0.2
-0.8
0.8
0.8
1.0
-5.8
0
1
2
3
4
5
6
7
8
9
10
11
12
0 2 4 6 8 10 12 14 16 18
China
US change in share of goods trade, 2017-2023
Average geopolitical distance of trade
Vietnam
ASEAN (excluding Vietnam)
Africa
Middle East Other Europe
and Central Asia
Latin America
Mexico
Canada
Europe Rest of Asia-
Pacific
Geographic distance, thousand kilometers
Key
Increase Decrease
Circle size =
trade share %Δ
Rising export of energy
resources and imports of
pharmaceutical goods
Rising electronics
imports
Electronics sector saw
largest drop in import share
– notably for cell phones
and laptops
Despite shifting imports,
the U.S. remained reliant
on China via third-
country routing, but 2023
anti-circumvention laws
may alter Vietnam and
ASEAN trade shares
Recent tariffs imposed by
President Trump announced
an additional 10% on imports
from China
Recent tariffs imposed by
President Trump place tariffs
on all imports from China