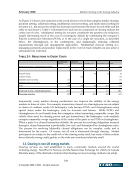
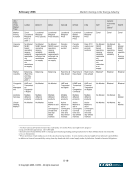
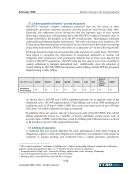
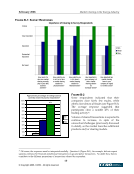
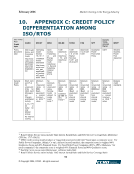
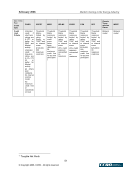
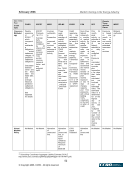
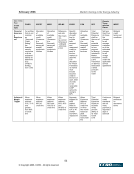
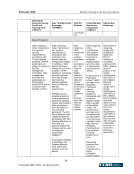
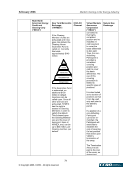
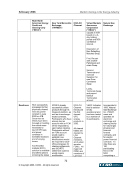
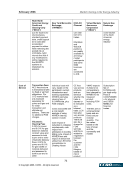
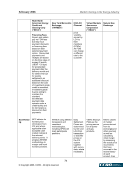
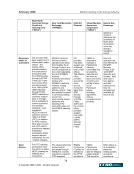
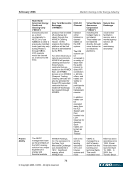
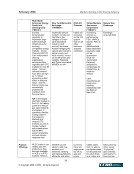
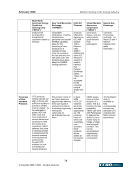
February 2006 Market Clearing in the Energy Industry 5-18 © Copyright 2006, CCRO. All rights reserved. need to better manage the credit exposure of their market participants 6 . As the ISO/RTOs continue to evolve, activities such as market design and new products, in many instances, has increased scope of services of the ISO/RTO, as well the number of market participants. But each type of expansion drives additional risks. With the credit quality crises that occurred in the industry post Enron, the ISO/RTOs have experienced ever-increasing activity as bilateral market liquidity and related credit opportunities have diminished. Further, in addition to the natural growth of participants with physical generation assets, financial institutions and energy hedge funds have entered the markets. PJM’s State of the Market reports indicate that spot market activity as a proportion of load in the Real-Time Energy Market increased from 18% in 2000 to a high of 40% in 2003, before dropping slightly to 35% in 2004. Meanwhile, spot market activity as a proportion of load in the Day-Ahead Energy Market increased from 15% in 2001 to a high of 32% in 2002, before dropping to 26% in 2004. This change of activity may be attributable in part to the deterioration of bilateral credit opportunities, as well as the use of the ISO/RTO as a surrogate market-clearing house (credit sleeve) by sub-investment grade or unrated market participants. There are two approaches taken by current vendors to resolve the issue. One is to address the decline in bilateral transactions by improving the credit quality of such transactions. The rehabilitation of the bilateral market would reduce the credit exposures of the ISO/RTOs. A second approach is to facilitate derivative transactions that can hedge the price risk of the companies transacting at the ISO/RTOs. In either case, challenges and issues remain before market clearing becomes widespread and fully embraced by this important segment of the market. 5.1.2. Varied products Each ISO /RTO tariff reflects differing design through its stakeholder process, including its credit policies (e.g., margining, settlement cycle, and scoring models). The flexibility in which each ‘market’ has developed has resulted in a challenging environment when viewed across markets by a single market participant. When clearing is considered among/between ISO/RTOs the challenge becomes greater as clearing is most efficient when market products are fungible and undifferentiated. The following table compares major features of ISO/RTOs, WSPP, and OAT transmission providers. 6 Some RTOs provide periodic exposure valuations. For example PJM provides a monthly spread of risk by rating category and monthly activity, while ISO-NE posts daily volumes on a web site.
Purchased by unknown, nofirst nolast
From: CCRO Library (library.ccro.org)